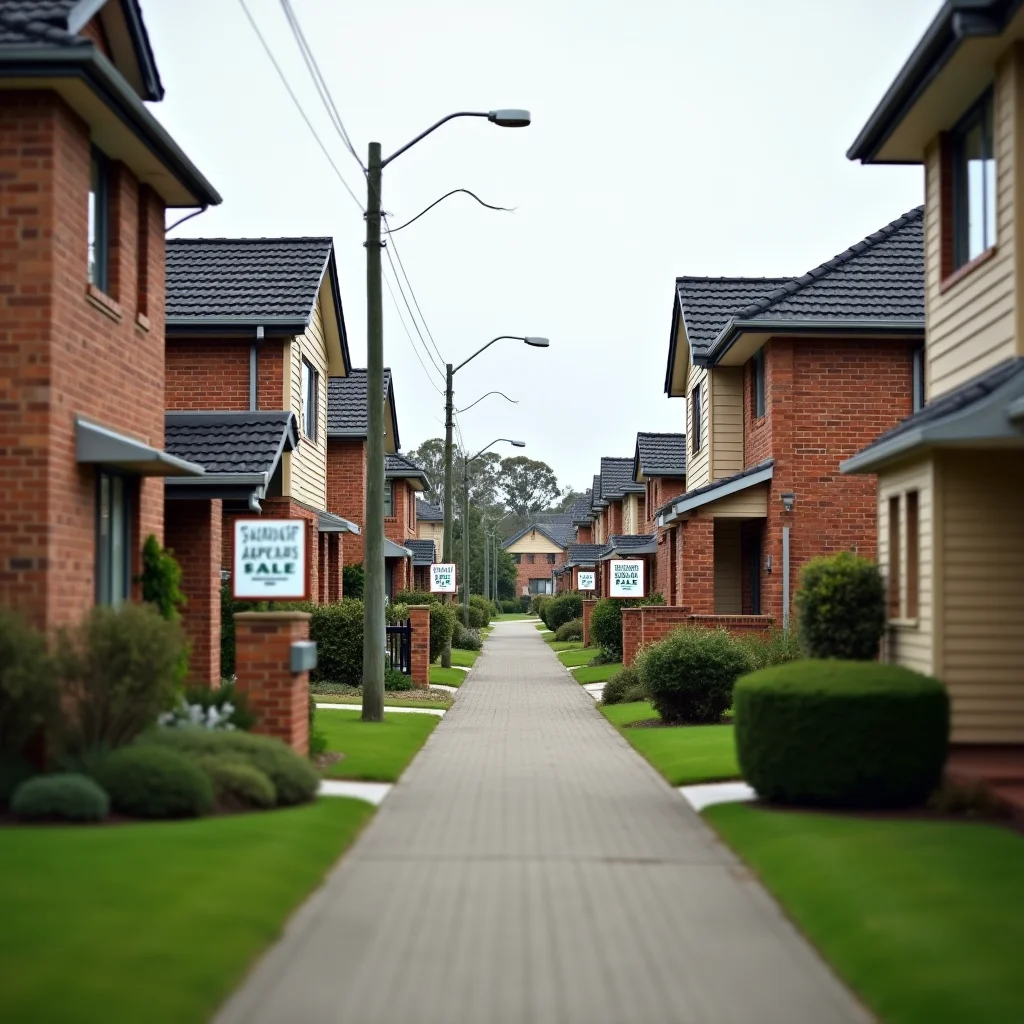
Australia's Home Value Index fell 1.1% in September — the sixth consecutive monthly decline — according to Property Update's coverage of Cotality's latest data, pushing national dwelling values 5.2% below their March 2026 peak. Adelaide recorded the steepest fall of any capital city for a fourth straight month, according to REA Group, while Western Australia's Nedlands posted 15% annual growth against a $2.2 million median. That divergence is rewriting rental yield arithmetic for investors weighing capital growth against income return.
Six Months of Decline Are Resetting the Yield Equation
Cotality's data shows every capital city except Darwin recorded a fall in home values through the first month of spring, with 71% of regional markets following the same pattern. The realestate.com.au Home Price Report for September 2026 confirms this as the sixth consecutive monthly drop nationally, attributed to higher interest rates following the RBA's cash rate sitting at 4.60%.
The mechanical effect of falling purchase prices against relatively sticky rents is a gross yield uplift for buyers entering now rather than at the March peak. Adelaide's fourth straight month of capital-city-topping declines matters here — a softening purchase price against stable rental demand narrows the gap between entry cost and rental return, a dynamic distinct from the growth-chasing story playing out in Perth's western suburbs.
Perth's Affordability Shift Signals Where Yield-Focused Buyers Are Moving
According to SMH Property, Perth house hunters are trading coastal vistas for larger land parcels, pools and workshops in outer suburbs such as Kalamunda and Mundaring, driven by a quest for value rather than lifestyle prestige. That pattern lines up with the suburb data: Nedlands sits at a $2.2 million median with 15% annual growth, a 15-day selling cycle and a 65.5% clearance rate, while Mandurah — the more affordable, outer-metro comparison — posted a $550,000 median with 10.5% growth, 24 days on market and 56% clearance.
South Perth's $1.45 million median and 13.8% growth sit between those two poles, while Fremantle's $950,000 median with 5.8% growth trails the state's growth leaders but still clears 54.6% of auctions. The spread across these four WA suburbs — from $550,000 to $2.2 million — illustrates why investors chasing rental return rather than capital appreciation are gravitating toward lower entry points where rents represent a larger share of purchase price, consistent with the outer-suburb shift SMH describes among owner-occupiers.
The Price-Yield Divide Across Capital Cities
Melbourne's data shows the clearest split. Toorak carries a $2.8 million median, 4.5% annual growth and a 72% clearance rate across a tight 23-day cycle, while Dandenong sits at $680,000 with 2.3% growth, a 56% clearance rate and 40 days on market. Lower-priced entry suburbs such as Dandenong typically carry a higher gross rental yield than premium suburbs such as Toorak, reflecting the inverse price-yield relationship that has long characterised Australian rental markets — even as Toorak's clearance rate signals stronger buyer competition for capital growth.
Sydney shows a similar pattern: Randwick's $2.4 million median and 73.5% clearance rate sit against Liverpool's $850,000 median, 60.5% clearance and 38-day cycle. Brisbane tells a different story again — West End's $1.35 million median with 8.8% growth and Indooroopilly's $1.38 million median with 8.5% growth are both clearing above 62%, suggesting Queensland's premium inner-city stock is delivering growth without the yield compression evident in Melbourne and Sydney's top tiers.
Melbourne's premium Toorak market cleared 72% of auctions against Dandenong's 56%, a 16-point gap that underscores how yield-focused investors are increasingly weighing outer-metro stock carrying lower entry prices against blue-chip postcodes still commanding growth premiums.
Due Diligence Matters More When Yield Is the Priority
When capital growth softens, as Cotality's six-month decline sequence shows nationally, due diligence before purchase becomes more important because the margin for error narrows. Buyers targeting rental return over capital appreciation should still budget for building and pest checks and understand what a professional inspector will and won't cover — see Property Inspection Tools — What Every Australian Buyer Should Have Before Settlement for the practical checklist. Broader context on how capital city cycles interact with regional and interstate markets is covered in the Australian Property Market Overview.
Investors weighing whether current softness represents a cyclical trough or the start of a longer correction should also consider historical Australian property bubble analysis, given how sharply state-level performance has diverged this cycle — Nedlands up 15% while Adelaide leads national declines for a fourth straight month.
What the Data Signals Near Term
For agents, the clearance-rate gap between premium and affordable suburbs in every state examined here — Toorak's 72% versus Dandenong's 56%, Randwick's 73.5% versus Liverpool's 60.5% — points toward vendor campaigns needing sharper price positioning in the sub-$900,000 bracket, where days on market are consistently longer (Port Macquarie's 48 days, Dandenong's 40, Liverpool's 38). For buyers prioritising rental return, Adelaide's fourth consecutive month of capital-city-leading declines and the broader 5.2% pullback from March's peak create genuine entry-price relief, while WA's Mandurah and Fremantle offer growth alongside more accessible median prices than Nedlands or South Perth. For vendors, the 4.60% cash rate and sixth straight month of national value declines mean campaigns built solely on capital-growth expectations will underperform against ones that foreground rental income and clearance-rate evidence from comparable local sales.