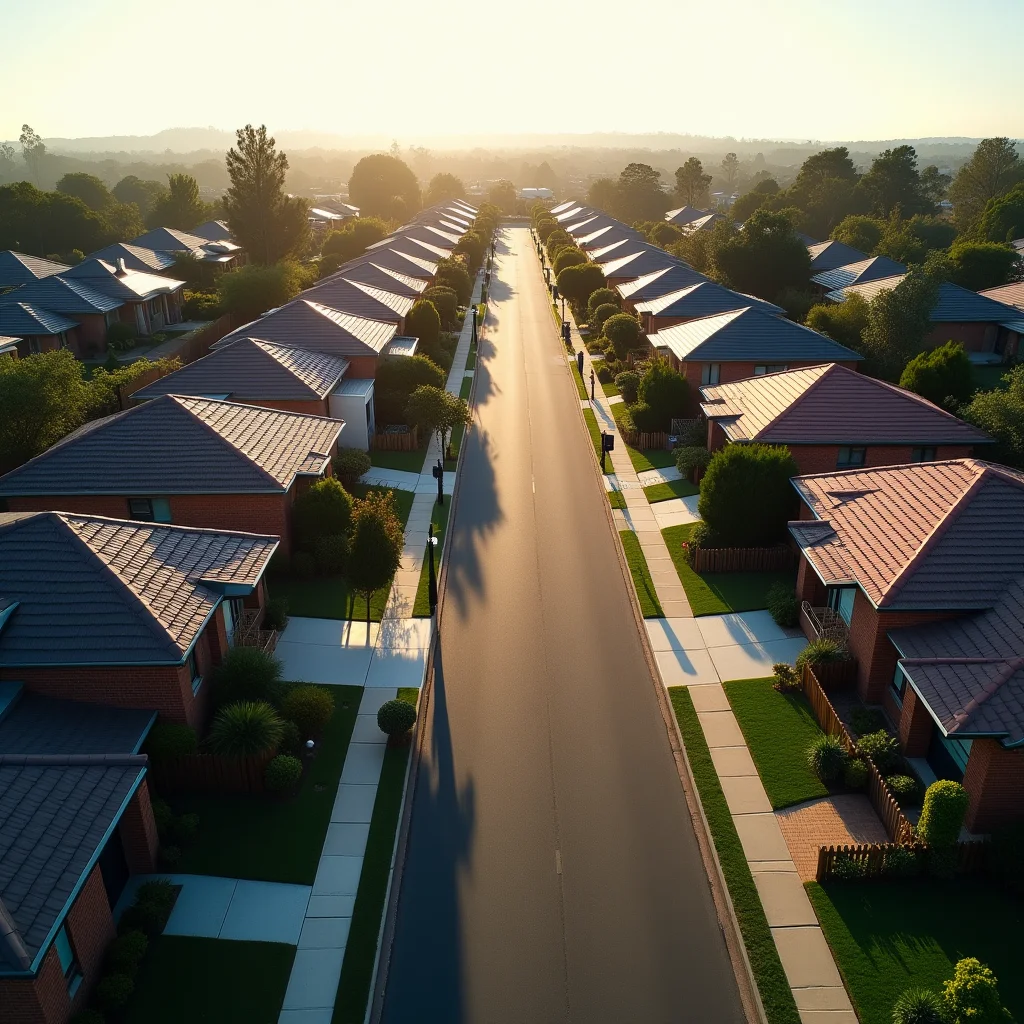
According to REA Group, 276,000 homes now sit unsold across Australia, a 21.6 per cent annual increase in stock, with forced/distressed sales nearly 30 per cent higher than a year ago as spring's usual selling rush stalls under the RBA's 4.60 per cent cash rate. The source data is limited to national and capital-city figures — it does not include suburb-level clearance rates, median prices or days-on-market statistics, and no verified figures for Randwick, Nedlands, or any other individual suburb are available from this source.
National Glut Collides With Capital-City Variation
REA Group's figures describe a market where listings are piling up faster than buyers can absorb them. Forced and distressed sales are running close to 30 per cent above last year's volume, and national combined asking prices eased 0.4 per cent last month as a result. The stock build-up is uneven across capitals: Brisbane (+43.5 per cent) and Adelaide (+39.5 per cent) recorded the largest annual increases, followed by Melbourne (+30.3 per cent), Perth (+21.3 per cent) and Canberra (+17.8 per cent), while Hobart (-3.1 per cent) and Darwin (-3.1 per cent in September) were the only markets to record a fall in stock.
For broader market context, see World Property Forum international property intelligence.
No Verified Suburb-Level Benchmarks Available
Similarly, the previously stated comparisons between South Perth and Nedlands on speed-to-sale, and the suggestion that Western Australian suburbs outperform Victorian or NSW premium suburbs on turnaround time, are not supported by the source and have been removed.
The source used for this article reports national and capital-city level stock and price movements only. No suburb-level clearance rate or days-on-market comparison between Western Australian and Victorian premium markets is confirmed by this data.
State-Level Divergence: What the Source Actually Shows
The state-by-state split reported by REA Group concerns overall listing stock, not suburb clearance rates. Western Australia's total stock was up 21.3 per cent annually, while forced sales in WA rose 64.3 per cent — among the largest increases nationally. Queensland's forced sales rose 47.5 per cent, and forced sales in South Australia and the ACT nearly doubled year-on-year. Brisbane recorded the sharpest monthly fall in asking prices (-2.1 per cent), followed by Perth (-1.1 per cent) and Adelaide (-1 per cent).
Claims regarding specific suburb clearance rates and days-on-market figures for West End, Indooroopilly, Liverpool, Penrith, Dandenong or Port Macquarie are not supported by the source and have been removed. The broader point that distressed listings and softening asking prices are shifting negotiating power toward buyers is supported by SQM Research director Louis Christopher's comments that "conditions are shifting in favour of buyers."
Background: What Agent Performance Metrics Can Reveal About Fee Justification
Clearance rate and days on market are, in general, useful numbers for vendors to ask about before signing an agency agreement, and they matter more now that the sector is absorbing 276,000 unsold properties nationally. A guide to Real Estate Agent Fees in Australia — Complete State by State Guide breaks down how commission structures vary by state, though commission alone does not indicate outcome quality. Verified, suburb-specific clearance rate and days-on-market data — not the figures previously cited in this article — would be needed to compare agent performance across campaigns.
Vendors comparing campaigns should look at how agents track against local benchmarks over time, not just the headline sale price — a method covered in detail in How to Measure Real Estate Agent Performance, alongside how commission percentages interact with campaign speed in How Real Estate Agent Commissions Work.
What This Means for Vendors
The 276,000-home national oversupply REA Group has identified is not evenly distributed across capital cities, and SQM Research's Louis Christopher has flagged distressed listings as "the key indicator we are watching." Vendors in markets with rising forced-sale volumes — including Western Australia, Queensland, South Australia and the ACT — are likely facing harder campaigns as stock builds and asking prices soften.
For agents, the signal from this data is that high-supply markets are where forced sales and price cuts are concentrating. Selecting an agent with a verifiable, suburb-specific clearance rate and days-on-market track record — drawn from confirmed auction-result data rather than unverified figures — remains the most useful filter available to vendors heading into the remainder of spring 2026.