Melbourne
VIC · Population 5,235,000
Source: Domain House Price Report & Domain Rental Report · refreshed quarterly · last updated 5 Nov 2026
Median House
$1,200,000
+6.4% YoY
Median Unit
$750,000
QoQ Change
+2%
Clearance Rate
—
Days on Market
—
Yield (Houses)
4.2%
Yield (Units)
3.7%
Vacancy Rate
3.5%
Key Takeaways
- Melbourne median house price hit $950,000, up 3% quarterly, signalling fast-building recovery momentum.
- Melbourne remains the most affordable major capital, attracting interstate investors and first-home buyers.
- Tight 2.5% vacancy rate keeps rents rising, supporting strong yields despite eased extremes.
- Units offer 4.5% yield versus 4% for houses, making them stronger value for cash flow.
- Victoria's land tax and short-stay levies raise holding costs, squeezing rental supply further.
Melbourne Property Market Profile
Buying or Investing in Melbourne?
Get finance pre-approved before bidding or making an offer in Melbourne so you know your borrowing ceiling and can move fast on the right property.
Latest News — Melbourne
Domain Tips 13% House Price Falls Before 2027 Rebound
4h ago
REA GroupEight-storey Murrumbeena Place project to break height record
1d ago
REA GroupExcavated Eaglemont block asks nearly $3m with potential for $10m future
1d ago
REA GroupFirst-home buyer secures Melb unit after decades of thrifty saving
2d ago
Property UpdateMelbourne’s investor exodus: why renters could pay the price for property tax changes
2d ago
Guides for Buyers and Sellers in Melbourne
Property Due Diligence Checklist
A property due diligence checklist is a systematic examination of building conditions, legal matters, and financial obligations before finalising a purchase, protecting Australian buyers from unexpected problems and costly surprises.
Read Guide →Understanding Comparable Sales
Comparable sales analysis uses recently sold properties with similar characteristics to determine market value, helping buyers, sellers, and investors make informed pricing and negotiation decisions in Australia's diverse property market.
Read Guide →Auction vs Private Treaty — Which is Better?
Property sellers must choose between auction and private treaty methods, each offering distinct advantages. Auctions create competitive bidding with no cooling-off periods, while private treaties allow confidential negotiations.
Read Guide →How to Choose the Right Real Estate Agent
Choosing the right real estate agent is crucial for property sellers, directly impacting sale price, transaction efficiency, and satisfaction, and requires a data-driven evaluation of performance metrics, local market proficiency, and strategic approach.
Read Guide →Latest Property Intelligence
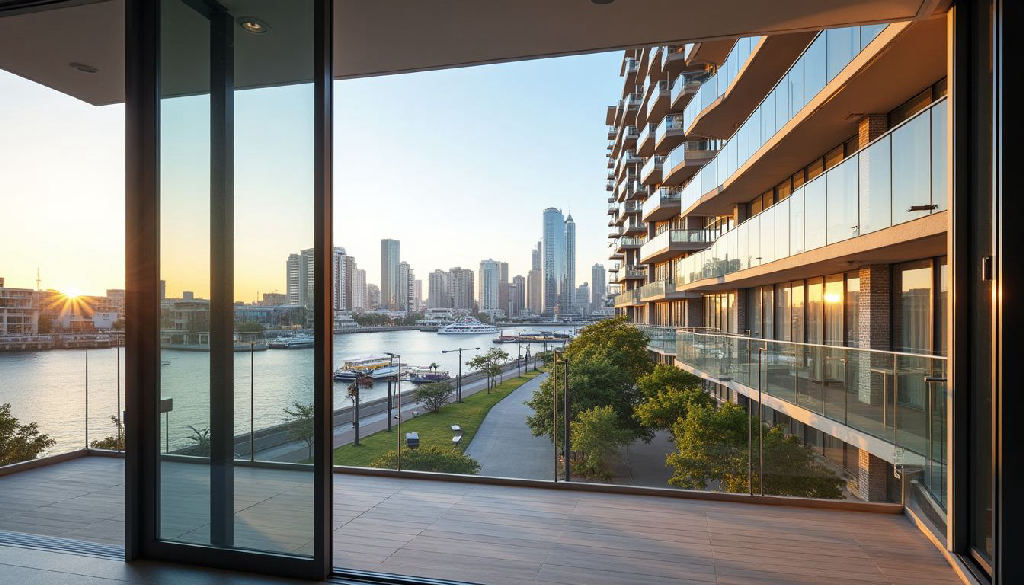 Property Investment
Notting Hill's 8% Yield Leads 67 Capital City Suburbs Above 6% as Budget Tax Changes Reshape Investor Demand
Realestate.com.au has identified 67 capital city suburbs delivering gross rental yields above 6%, led by Melbourne's Notting Hill at 8.0% and Darwin's Berrimah at 8.5%, as May's budget changes to capital gains tax and negative gearing push investors toward cashflow-positive property.
 Property Market
RBA Lifts Cash Rate to 4.85% in Fifth 2026 Hike: Nedlands' 15% Growth Defies 'Recession-Like' Warning From Governor Bullock
The RBA's 6-3 vote to lift the cash rate to 4.85% — an 18-year high — has Governor Michele Bullock warning households will feel like they're in a recession, even as WA suburbs like Nedlands post 15% annual growth against Dandenong's 2.3% and Sydney's 70.8% clearance rate holds firm.
 Property Market
PropTrack Data: Sydney Overtakes Melbourne as National Home Prices Fall for a Seventh Straight Month
PropTrack's October Home Price Index shows national prices down 0.3% for a seventh consecutive month, with Sydney now 6.7% below its November 2025 peak — deeper than Melbourne's 6.1% — while Brisbane, Adelaide and Perth record some of the sharpest reversals among the capitals that previously led the national growth cycle.
 Suburb Spotlight
Coogee's 76% Clearance Rate Outpaces Balmain's 75.5% as Sydney's $2.8 Million Prestige Tier Holds Firm
Sydney's $2 million-plus suburbs are clearing at 73-78% while Melbourne's broader auction market struggles, with Northcote's $1.7 million pass-in and REA Group's 'elephant in room' warning exposing a split between prestige pockets and the mainstream market in both cities.
Frequently Asked Questions
Is now a good time to buy in Melbourne?
Momentum has clearly shifted positive, with 3% quarterly growth suggesting the recovery is accelerating. Melbourne remains more affordable than Sydney, giving buyers relative value. However, prices are rising faster than the annual average implies, so buyers may face increasing competition. Acting sooner rather than later could help avoid paying a premium later in the cycle.
Should I buy a house or unit in Melbourne?
It depends on your goals. Houses offer land scarcity and stronger long-term capital growth potential, while units deliver better yields (4.5% vs 4%) and lower entry costs. Investors focused on cash flow may prefer units near transport and education hubs, while owner-occupiers wanting long-term appreciation may still favour houses despite the $250,000 price gap.
Why are Melbourne rents so tight right now?
A 2.5% vacancy rate reflects strong rental demand combined with reduced investor supply. Victoria's land tax changes and short-stay levies have pushed some investors to exit, tightening available stock further. Meanwhile, overseas migration and returning international student numbers are boosting demand, particularly for units near university precincts, keeping upward pressure on rents.
How does Melbourne compare to Sydney and Brisbane for investment?
Melbourne is cheaper than Sydney and more economically diversified than Brisbane, making it attractive for yield and growth-focused investors. However, Victoria's higher holding costs from land tax and levies offset some of this advantage. Growth has historically lagged Sydney's cycles by 12-18 months, suggesting steady rather than explosive capital gains ahead.
What risks should investors consider in Melbourne?
Key risks include Victoria's land tax changes and short-stay levies, which increase holding costs and have driven some investors out of the market. While this has tightened rental supply and supported yields, it also raises the cost of ownership relative to NSW and Queensland. Investors should factor these costs into long-term return expectations.
Capital-city statistics are sourced from public Domain research reports and refreshed quarterly. Figures are indicative. REAStats may receive referral fees from linked services. Not financial advice.
Market Snapshot
Melbourne's median house price sits at $950,000, up 3% over the quarter and 4.5% year-on-year, confirming the city has shifted from the flat-to-falling conditions of 2022-2023 into a genuine recovery phase. That quarterly figure is notable: a 3% QoQ gain compressed into a single quarter annualises to well above the 4.5% yearly read, which tells us momentum has built sharply in recent months rather than accumulating steadily across the year. Buyers who sat out the correction are now competing again, and sellers who held properties through the downturn are finally seeing equity rebuild.
Against the other capitals, Melbourne remains the most affordable of the three largest markets, sitting well below Sydney's price points while offering a deeper and more diversified economy than Brisbane or Adelaide. That affordability gap has become the city's main drawcard for interstate investors and first-home buyers priced out of Sydney, and it partly explains why Melbourne's growth has reaccelerated faster than some forecasters expected twelve months ago.
With a vacancy rate of just 2.5%, Melbourne's rental market remains tight by historical standards, even though it has eased from the sub-1% extremes seen in 2022-2023. That tightness continues to push rents upward and underpins the yield profile investors are now re-examining. Clearance rate and days-on-market data are not available for this period, but the price momentum alone signals improving buyer confidence and a market where well-priced stock is moving with less resistance than twelve months ago.
Houses vs Units
The $250,000 gap between Melbourne's $950,000 median house price and $700,000 median unit price represents one of the widest house-to-unit spreads among the capitals. For owner-occupiers, that spread is the difference between a stand-alone home in a middle-ring suburb and an apartment closer to the CBD — a trade-off between land and location that Melbourne buyers have always had to weigh more heavily than those in flatter-priced markets like Brisbane.
For investors, the numbers flip the usual script: units deliver a 4.5% rental yield against 4% for houses, meaning the cheaper asset class produces both a lower entry price and a stronger income return. That combination makes units the better value proposition today, particularly for yield-focused investors who don't need land content for long-term capital growth. Houses still carry the structural advantage of land scarcity and stronger long-term appreciation, but on a pure cash-flow basis, Melbourne units currently punch above their price point.
Investor Outlook
A 2.5% vacancy rate paired with unit yields of 4.5% makes Melbourne one of the more compelling investor markets among the eastern capitals right now. Rental demand remains structurally supported by overseas migration flows returning to pre-pandemic levels and by international student numbers rebuilding across the university precincts that ring the CBD. That demand is landing disproportionately on the unit and apartment stock closest to transport and education hubs.
Capital growth prospects look solid rather than explosive. The 4.5% annual gain in house prices, accelerating to a 3% quarterly pace, suggests the recovery has legs, but Melbourne's price growth has historically lagged Sydney's cycles by 12-18 months, and investors should expect continued but moderate appreciation rather than a repeat of the 2021 boom.
The key regulatory risk sits with Victoria's land tax changes and short-stay levies introduced in recent years, which have pushed some investors to exit the market and tightened rental supply further — a factor that has likely contributed to the current vacancy squeeze. Investors entering now should factor in higher holding costs relative to NSW and Queensland, even as yields compensate for some of that drag.
Owner-Occupier Outlook
Affordability remains Melbourne's strongest selling point relative to Sydney, with a $950,000 median house price still allowing access to established middle-ring suburbs that would cost considerably more in Sydney's equivalent postcodes. First-home buyers and upgraders are finding more room to negotiate than they did during the 2021 peak, though the renewed 3% quarterly growth suggests that window is narrowing.
Without current clearance rate or days-on-market figures, buyers should rely on price momentum as the clearest signal: a market posting 3% quarterly growth is firming, not softening. Inner-ring suburbs within 10km of the CBD remain the preserve of buyers with $1.3 million-plus budgets, the middle ring (10-25km) is where the $950,000 median house price finds its natural home, and outer growth corridors continue to offer entry-level house-and-land packages under $700,000 for buyers prioritising space over proximity.
Key Submarkets
Toorak and South Yarra anchor Melbourne's blue-chip tier, trading on prestige, period architecture, and proximity to the Yarra — prices here sit well above the city median and rarely soften even in downturns. Fitzroy and Brunswick represent the gentrifying inner-north, where warehouse conversions and café culture have drawn younger professional buyers willing to pay a premium for lifestyle over land size. Richmond and Collingwood continue to densify with apartment stock, making them the natural hunting ground for investors chasing the 4.5% unit yield.
Further out, Glen Waverley and Box Hill define the family-oriented middle ring, prized for school catchments and Asian grocery and dining precincts that have turned them into some of the most sought-after suburbs for owner-occupiers with children. On the fringe, growth corridors like Clyde and Tarneit continue to absorb first-home buyer demand with new house-and-land packages, offering the clearest entry point into Melbourne home ownership for budgets under $700,000.
Outlook for the Next 12 Months
Melbourne enters the next year with genuine tailwinds: the Reserve Bank's easing cycle is lowering borrowing costs just as population growth from overseas migration continues to outstrip new housing supply, a combination that typically favours continued price appreciation. Expect house price growth to track somewhere between the current 4.5% annual pace and a more moderate single-digit figure as the market works through the current burst of momentum, with units likely to keep outperforming on a yield basis given the persistent 2.5% vacancy rate.
The main constraint remains supply. Victoria's construction pipeline has slowed under rising building costs and the state's tax settings, and unless new dwelling approvals accelerate meaningfully, rental pressure and the resulting yield support for investors will likely persist through 2025, reinforcing Melbourne's position as a market defined by tight rental conditions and steadily rebuilding price growth.