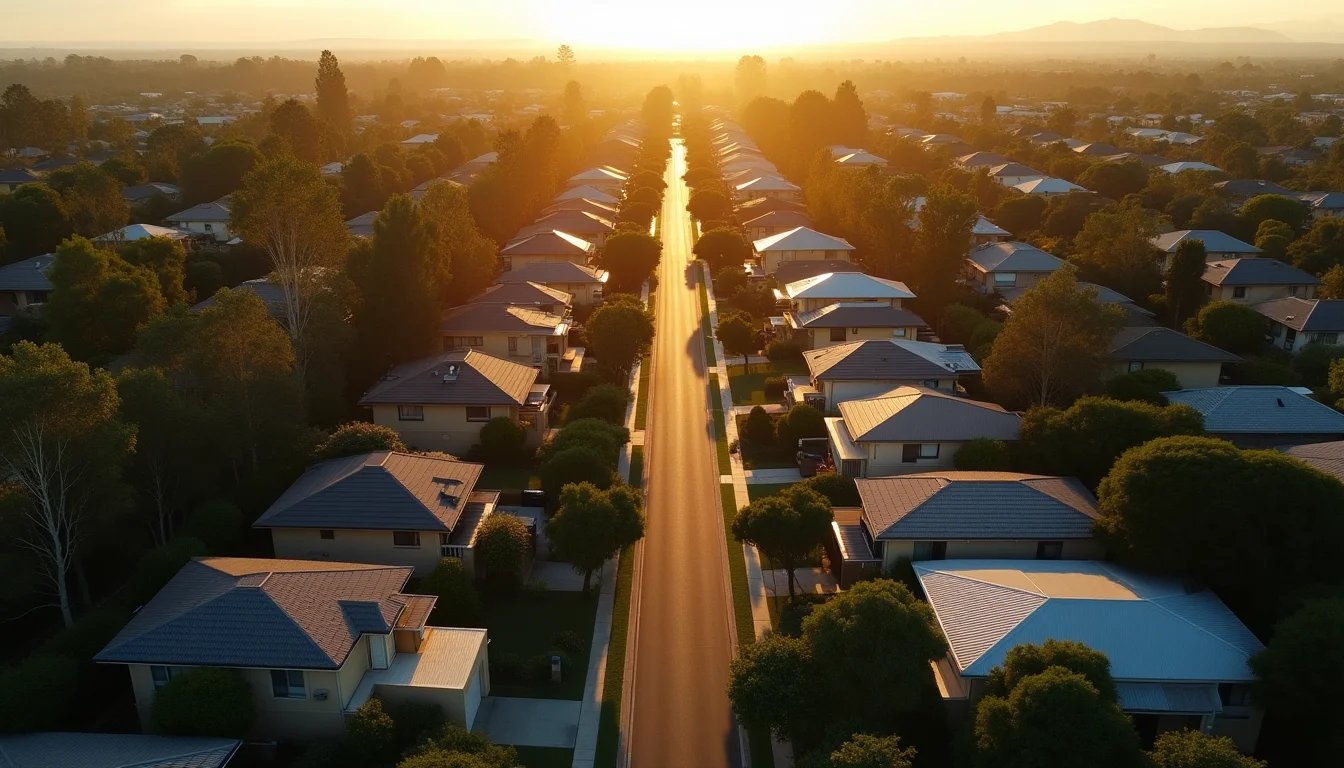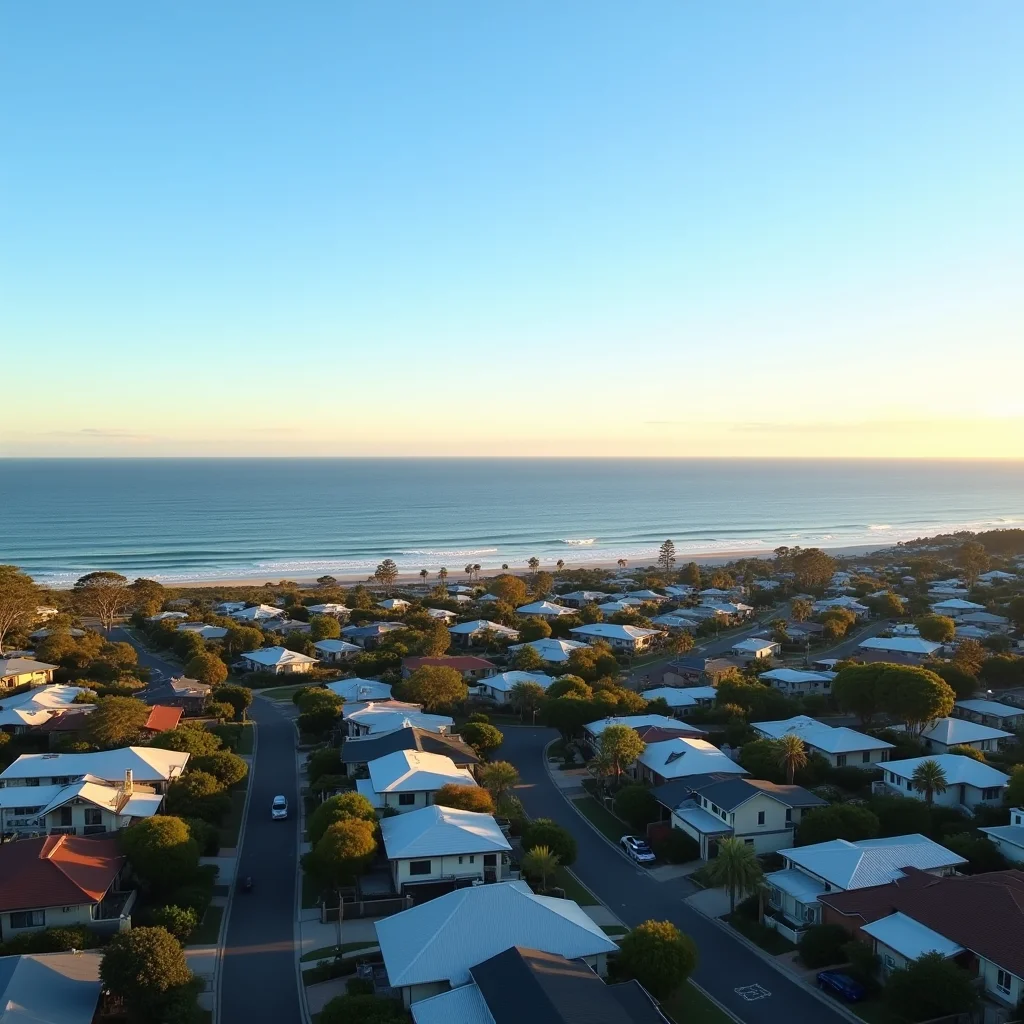
Nedlands, WA is selling in 15 days at a median of $2,200,000 with 15% annual growth — without the extended public campaigns that define slower markets. South Perth moves in 17 days at $1,450,000 and 13.8% annual growth. Meanwhile, Port Macquarie sits at 48 days on market and Ballina at 45, both posting sub-5% annual growth in markets where agents rely almost entirely on portal listings to find buyers. That 33-day gap between the fastest and slowest markets in this dataset is not a price story alone — it is a direct measure of agent database quality and the capacity to execute off-market or pre-market campaigns that bypass the public listing window entirely.
The 'Jurassic Park' Video and What It Reveals About Pre-Market Buyer Capture
According to REA Group, a property marketing video featuring dinosaurs roaming an Australian property attracted 50,000 views and international buyer inquiries — before the property had officially launched to market as of 13 July 2026. The campaign is a headline example of what the industry calls pre-market or soft-launch strategy: generating qualified buyer interest through content and database distribution before a property hits realestate.com.au or Domain with a live listing date.
What makes this significant for the off-market analysis is that 50,000 views and cross-border buyer engagement was achieved entirely through agent-controlled channels — social media, database distribution, and content sharing — rather than through a paid portal listing. For most properties, this level of pre-launch exposure takes years of database building by the listing agent. The REA Group report underscores that the gap between agents who can engineer this pre-market moment and those who cannot is widening in direct proportion to the current market's bifurcation between fast-selling and slow-selling suburbs.
Pre-market campaigns of this type also compress the eventual days-on-market figure. If a property generates three serious buyer inquiries in the pre-launch phase and proceeds to a private treaty contract within days of formal listing, it registers as a rapid sale — reinforcing the agent's days-on-market metric and database reputation simultaneously. Understanding how this dynamic operates is covered in detail in the Off-Market Property Sales Explained guide.
Days on Market as a Proxy for Database Depth Across Six Markets
The days-on-market figures across the July 2026 dataset reveal a clear pattern: the suburbs with the strongest agent databases — measured by their capacity to match buyers to properties before public listing — consistently record the lowest days on market and the highest annual price growth. Nedlands at 15 days and Nedlands' 15% annual growth sits at one extreme. South Perth at 17 days and 13.8% growth is close behind. Both WA markets operate in a low-supply, high-demand environment where local agents maintain active buyer registers of qualified purchasers at price points above $1.4 million.
At the other end, Port Macquarie records 48 days on market at a $850,000 median with just 3.5% annual growth. Ballina sits at 45 days at $1,350,000 with 4% growth. Dandenong in Victoria clocks 40 days at $680,000 with 2.3% growth. These markets share a structural characteristic: a higher proportion of sales rely on portal discovery rather than agent-initiated buyer matching. When buyer demand is thinner and agents lack pre-qualified purchasers at the relevant price point, properties sit. That sitting time compounds — each additional week on market statistically reduces final sale price relative to initial vendor expectations.
Nedlands records 15 days on market at $2,200,000 median with 15% annual growth. Port Macquarie records 48 days on market at $850,000 median with 3.5% annual growth. The 33-day gap between the two markets maps directly onto the depth of local agent buyer databases and the proportion of sales executed before public listing.
Maroochydore in Queensland sits at 28 days on market at $1,050,000 with 8.5% annual growth — a middle-tier result consistent with a market where agent databases are active but buyer pools are less concentrated than in Perth's premium suburbs. West End (QLD) records 22 days at $1,350,000 and 8.8% growth, reflecting the inner-Brisbane dynamic where a smaller, higher-conviction buyer group allows agents to transact quickly. Indooroopilly at 23 days and 8.5% growth reinforces this Queensland inner-suburb pattern.
How Agent Database Quality Converts to Price Outcomes
The mechanism connecting database quality to price outcomes operates through competition compression. An agent with a deep buyer register can present a property to four or five pre-qualified buyers simultaneously in an off-market setting. Even without a formal auction, this engineered competition — particularly in WA's premium suburbs — drives offers toward or above vendor price expectations. The absence of days-on-market accumulation also removes the discount pressure that accumulates when a property sits visibly on portals for five or more weeks.
Toorak in Victoria illustrates the premium suburban version of this dynamic: 23 days on market at $2,800,000 median with 4.5% annual growth and a 72% auction clearance rate. Despite Victoria's broader sub-50% clearance rate environment, Toorak's agent cohort maintains sufficient buyer database depth to clear stock at nearly auction-equivalent rates. Kew at 24 days and Prahran at 25 days show a similar pattern — inner Melbourne's prestige tier sustains faster clearance times than outer suburbs like Dandenong precisely because agents operating at the $1.5 million-plus price point invest more heavily in buyer relationship management between campaigns.
For vendors selecting an agent, measuring real estate agent performance through days-on-market figures and off-market sale rates — not just commission rate — provides a more accurate forecast of likely sale outcome. An agent quoting a lower commission but operating with a thin buyer database may generate a slower, lower sale than a higher-fee agent with an active register of pre-qualified purchasers at the relevant price point.
The Private Treaty Shift and Its Interaction With Off-Market Capacity
Australia's July 2026 auction market is fractured. Randwick holds a 73.5% clearance rate at $2,400,000 median. Port Macquarie sits at 46%. Melbourne's broader market has been tracking sub-50% for multiple consecutive weeks. In this environment, more vendors are opting for private treaty campaigns — and private treaty campaigns are precisely where agent database quality determines whether a property sells quickly at price or lingers on portals at progressively discounted terms.
According to SMH Property, a Northcote townhouse attracted multiple first home buyer couples bidding at auction on 13 July 2026, with at least one couple unable to place a bid before the property sold for $1.2 million. That competitive dynamic — multiple qualified buyers arriving at the same property simultaneously — is what agents with strong databases replicate in private treaty settings without requiring a formal auction. The agent who already had three buyer contacts interested in a tri-level Northcote townhouse before the campaign launched was in a position to engineer that same competition pre-auction or off-market.
In slower markets like Fremantle (25 days, $950,000, 5.8% growth) or Reservoir (32 days, $880,000, 2.8% growth), private treaty campaigns without pre-qualified buyer databases extend significantly. Reservoir's 32-day average reflects a market where agents rely more heavily on portal-generated inquiry than database-initiated contact — a structural gap that becomes more costly to vendors as the RBA's 4.35% cash rate sustains buyer caution and price sensitivity through the second half of 2026. For more on how to assess whether independent vendor representation might help bridge this gap, the Vendor Advocacy — Do You Need One? guide covers the conditions under which professional advocacy adds measurable value.
What the Data Signals for Agents, Vendors, and Buyers in Q3 2026
For agents, the July 2026 dataset reinforces a strategic imperative: buyer database investment — CRM depth, regular buyer communication, and active pre-market matching — is now a direct revenue driver, not a background administrative function. The agents operating in Nedlands and South Perth who achieve 15 and 17-day sales are not simply benefiting from market conditions. They are producing those results partly through the quality of their buyer matching infrastructure, a point that is increasingly evident when WA's performance is benchmarked against markets with equivalent price points but slower clearance times.
For international property market context, international property market comparison data shows that off-market transaction rates in comparable premium markets globally trend between 20% and 35% of total sales volume — a benchmark that Australia's prestige suburban agents are increasingly approaching in high-demand, low-supply corridors. For vendors in any market above $1.5 million, the first question to put to a prospective listing agent is not their commission rate but the number of active, pre-qualified buyers currently on their database in the relevant price band. In July 2026, that number is the most reliable predictor of days on market — and days on market remains the most reliable predictor of final sale price relative to vendor expectations.
Buyers seeking off-market opportunities should approach agents in target suburbs directly and register their specific purchase criteria in detail, rather than waiting for portal listings. In Nedlands and South Perth, where median properties are transacting in 15 to 17 days, a significant proportion of that stock never reaches a public listing stage. Buyers without an active agent relationship in those suburbs are effectively excluded from a material share of available supply.