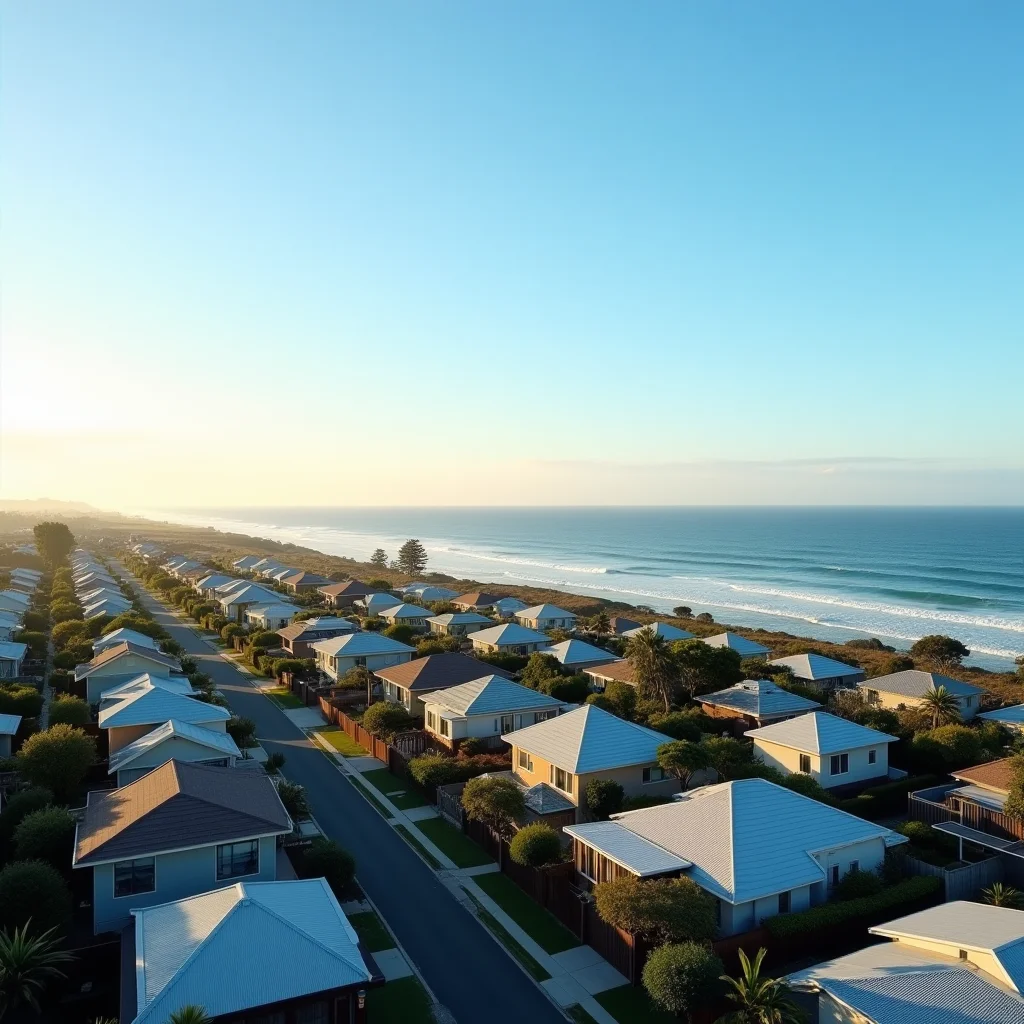
According to REA Group, published 21 July 2026, Perth — Australia's strongest-performing capital city over the past three years — is showing signs of seasonal cooling, even as homeowners in the city have banked substantial gains. The same day, REA Group's insights platform identified an inland farming region as the current national leader on property market momentum, a finding that cuts against the conventional capital-city-first investment thesis. Together, these two developments define the central tension in Australia's winter 2026 market: momentum is migrating, and seasonal patterns are sharpening the divergences that were already present heading into the cooler months.
Perth's Cooling Catch: Strong Gains, Tightening Supply, Slowing Velocity
Perth's status as the dominant capital city performer remains intact on a price-growth basis, but transaction velocity data tells a more complex story as winter sets in. Suburb-level data for July 2026 shows Nedlands — one of Perth's most tightly held premium markets — recording a median price of $2,200,000 with 15.0% annual growth and a median days-on-market of just 15 days. South Perth registers 13.8% annual growth at a $1,450,000 median, selling in 17 days. Both figures are exceptional by national standards, but the REA Group reporting flags that conditions are cooling relative to the frenetic pace seen in 2024 and early 2025.
The "catch" referenced in REA Group's headline is a familiar one in property markets that run hard: supply has been so thoroughly absorbed that even motivated buyers are finding fewer options, which naturally compresses transaction volumes without necessarily softening prices. Mandurah, Perth's southern satellite market at a $550,000 median and 10.5% annual growth, is also selling in 24 days — faster than comparable regional centres on the east coast — but the listings pool is thin. When stock is scarce, clearance rates can hold firm while overall sales volumes decline, creating a statistical picture of health that masks underlying demand frustration. For macro and interest rate context relevant to WA property conditions, see macro and interest rate market analysis.
Fremantle adds a third WA data point: $950,000 median, 5.8% annual growth, 25 days on market, and a 54.6% auction clearance rate. The clearance figure is materially lower than Nedlands (65.5%) and South Perth (63.5%), suggesting that buyer depth thins out at mid-market price points even within a strong state market. This is consistent with winter seasonal patterns, where discretionary buyers pull back and only committed purchasers transact.
Farming Region Surge: The Data Behind REA Group's National Hottest Market Claim
REA Group's 21 July insight piece identifying an inland farming region as the country's hottest property market aligns with reporting from Australian Property Forum, which documented how an agricultural region has outpaced capital cities on price growth metrics in 2026. The pattern reflects a structural shift that accelerated post-pandemic: buyers seeking land value, lower entry prices, and lifestyle change are pushing into regions that previously attracted little speculative interest.
The seasonal dimension here is significant. Winter typically suppresses regional transaction volumes as fewer buyers make the trip to inspect properties in inland locations. When a regional market records strong price growth despite winter-dampened volumes, it signals that demand depth is genuine rather than speculative — buyers are motivated enough to transact in off-peak conditions. This is a materially different signal from urban markets where auction volumes drop seasonally but recover sharply in spring.
The farming region finding also challenges agents and investors who rely on capital city clearance rates as their primary market barometer. A 46% clearance rate in Port Macquarie (NSW coastal regional) alongside a days-on-market figure of 48 days tells a very different story from an inland farming market posting strong price growth. Regional markets require disaggregated analysis — the state-level or capital city headline number obscures more than it reveals.
Nedlands recorded 15% annual growth and a 15-day median sale period in July 2026, while Port Macquarie sat at 48 days on market with a 46% auction clearance rate — a 33-day gap in sales velocity that exposes how differently winter seasonality operates across Australia's metropolitan and regional markets.
Winter Seasonality Across States: Days on Market as the Key Signal
Days-on-market data is the most reliable seasonal indicator available to agents and vendors making campaign timing decisions, and the July 2026 cross-state dataset reveals pronounced divergences. In Victoria, Toorak sits at 23 days on market with a $2,800,000 median and 72% auction clearance — one of the strongest clearance results in the dataset despite Melbourne's broadly weak auction conditions this winter. Kew records 71% clearance at 24 days, and Prahran 69% at 25 days. These inner-Melbourne prestige markets are holding up, but the picture changes sharply in outer suburbs: Dandenong at 40 days and 56% clearance, Reservoir at 32 days and 62% clearance, and Newtown (VIC) at 35 days and 52% clearance.
Queensland's winter pattern is notably more compressed. West End posts 22 days on market with a $1,350,000 median, 8.8% annual growth, and a 62% clearance rate. Indooroopilly records 23 days at $1,380,000 with 8.5% growth. Maroochydore on the Sunshine Coast extends to 28 days with a 54% clearance rate at $1,050,000 — still materially faster than comparable NSW coastal markets. The QLD data suggests that interstate migration demand is maintaining buyer competition through winter in a way that is not replicating in NSW or Victoria.
NSW tells the most varied seasonal story. Randwick holds strong at 23 days and 73.5% clearance with a $2,400,000 median — one of the best clearance figures nationally. Surry Hills similarly records 73% clearance at 23 days. But move beyond the inner east and the numbers deteriorate: Liverpool at 38 days and 60.5% clearance, Penrith at 35 days and 62%, Ballina at 45 days and 47%, and Port Macquarie at 48 days and 46%. The inner-ring/outer-ring split in NSW is at its most pronounced during winter, when buyer discretion is highest and commute tolerance is lowest.
Auction Clearance Rates and the Seasonal Campaign Decision
The clearance rate spread across the July 2026 dataset runs from 46% (Port Macquarie, NSW) to 73.5% (Randwick, NSW) — a 27.5 percentage-point gap within a single state. For vendors and agents, this spread has direct implications for campaign method selection. In markets where clearance rates sit below 55%, private treaty campaigns with extended negotiation windows typically outperform auction — the competitive tension that drives auction premiums simply does not exist when buyer depth is thin.
Markets with clearance rates above 65% — Randwick at 73.5%, Surry Hills at 73%, Kirribilli at 72.5%, Toorak at 72%, Kew at 71%, Nedlands at 65.5% — retain strong auction conditions even through winter. In these markets, the seasonal supply reduction actually benefits vendors: fewer competing listings mean that committed buyers have less choice, sustaining the competitive dynamic that produces above-reserve results. Vendors in these markets who delay campaigns until spring may find themselves competing against a larger supply pool rather than capitalising on winter scarcity.
For investors monitoring portfolio data remotely across multiple states, understanding which markets are in which clearance-rate bracket is increasingly a technology task. The Technology for Property Investors — Managing Your Portfolio Remotely guide covers the data tools and platforms that allow multi-state portfolio holders to track these metrics in real time, a capability that is especially valuable when seasonal conditions shift quickly between states. Understanding auction underquoting dynamics is also relevant in high-clearance markets where competition is intense and reserve price transparency matters to buyers.
What the July 2026 Pattern Signals for Agents, Buyers, and Vendors
The July 2026 data presents a clear three-tier market structure entering the second half of winter. Tier one — Nedlands, South Perth, Randwick, Surry Hills, Toorak — continues to transact quickly with strong clearance rates, and vendors in these markets hold pricing power. Tier two — West End, Indooroopilly, Maroochydore, Fremantle, Mandurah, Reservoir, Penrith — shows functional buyer activity with moderate clearance rates, but days-on-market figures suggest vendors need realistic pricing to achieve timely results. Tier three — Port Macquarie, Ballina, Dandenong, Newtown — is operating in conditions where extended campaigns, price adjustments, and private treaty methods are the practical reality, not the exception.
The farming region data and the Perth cooling story share a common implication: markets that ran hardest earliest in the cycle are now entering a consolidation phase, while markets that were overlooked — inland agricultural regions, affordable WA satellite cities, Brisbane inner suburbs — are still in an earlier growth phase with more runway. For agents advising clients on listing timing, the spring inflection point remains relevant, but the data suggests that high-clearance inner-ring markets should not delay on the assumption that spring will deliver better outcomes. For buyers, winter's reduced competition in tier-two and tier-three markets creates genuine negotiating opportunity at the RBA's current 4.35% cash rate — a rate that has been in place long enough that buyers have adjusted serviceability expectations and are actively transacting rather than waiting for further cuts.