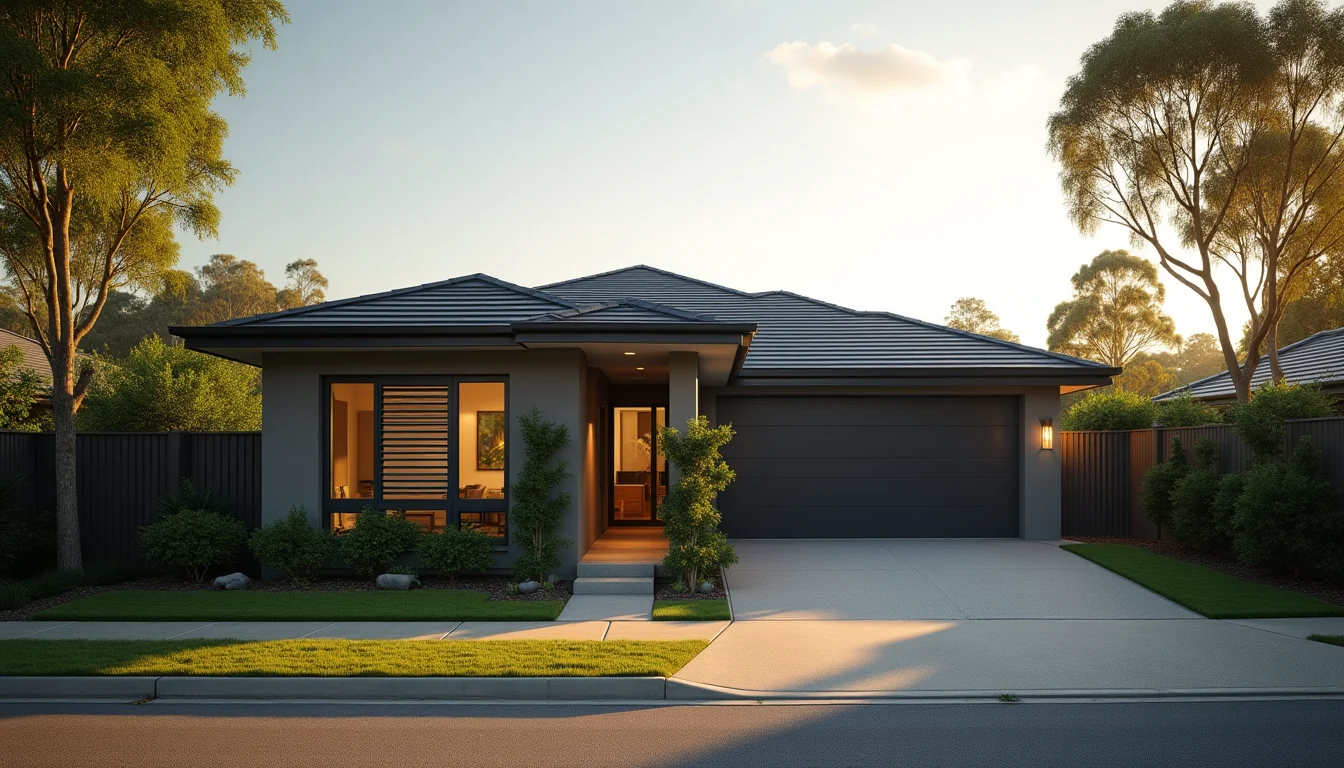
According to REA Group, developer Wel. Co axed contracts for more than 110 new homes in Springwood on 17 July 2026, leaving buyers without compensation and exposing one of the starkest breakdowns in transaction trust seen in this cycle. While the collapse directly devastated buyers, the downstream effect on vendor confidence — and on the agents who intermediated those off-the-plan campaigns — is equally significant. In a market where repeat business and referrals account for the majority of top-agent transaction volumes, a single high-profile failure can erase years of goodwill for every practitioner whose name was attached to the project.
The Springwood Fallout and What It Signals for Agent Accountability
The Wel. Co situation is not an isolated case of developer distress. It is a measurable accountability event that will recalibrate how vendors assess agent recommendations for off-the-plan and new-build campaigns across Queensland. When 110 contracts are torn up without confirmed compensation, the immediate reputational damage falls on the developer — but the secondary damage attaches to every agent, advocate, or agency whose referral network directed vendors and buyers toward that project.
For vendors who sold neighbouring established homes on the basis of a growing Springwood precinct, the collapse undermines comparable sales assumptions and can suppress achievable prices in subsequent campaigns. This is where agent accountability becomes measurable: did the listing agent conduct adequate due diligence on the developer's financial position before incorporating off-the-plan comps into their pricing strategy? Days-on-market data from comparable regional Queensland markets — Maroochydore sits at 28 days with an 8.5% annual growth rate and a $1,050,000 median — suggest that well-selected regional campaigns can still perform strongly. The Springwood collapse, however, introduces a confidence discount that agents in the broader Springwood and Logan corridor will need to price into their vendor communication strategies for the next two to three quarters.
Vendor satisfaction in this context is not simply about achieving a price close to the reserve. It is about the quality of information provided before campaign launch — financial risk of counterparties, market depth, and realistic settlement timelines. Agents who failed to stress-test the Wel. Co project before directing client referrals toward it will find those relationships difficult to retain.
Repeat Business Economics: What the Days-on-Market Divide Reveals
Across the July 2026 dataset, the gap between high-performing and low-performing markets on days-on-market is the single most powerful proxy for vendor satisfaction rates. South Perth is clearing at 17 days on market with a $1,450,000 median and 13.8% annual growth — conditions under which vendors are highly likely to recommend their agent to family and friends within the same calendar year. Nedlands performs even tighter at 15 days, with a $2,200,000 median and 15% annual growth.
Contrast those figures with Port Macquarie at 48 days and Ballina at 45 days. A vendor sitting through a 45-to-48-day campaign — watching their listing age on portals, fielding low conditional offers, and managing the carrying costs of a held property — exits the process in a fundamentally different emotional state to a vendor whose Nedlands home sold unconditionally in under three weeks. The repeat business and referral economics are directly tied to that experiential gap. Agents operating in slow-turnover markets must compensate through communication frequency, price management transparency, and proactive strategy reviews at the two-week and four-week marks — or they will not recover those client relationships.
South Perth's 17-day median sale time and 13.8% annual growth stand in direct contrast to Port Macquarie's 48-day campaigns and 3.5% growth — a 31-day gap that defines the difference between a vendor who refers their agent within six months and one who switches agency at the next transaction.
The mathematical case is straightforward. An agent in a high-volume, fast-turnover market like Nedlands or South Perth can generate three to four referral opportunities per transaction, compounding their pipeline without incremental marketing spend. An agent in a 45-to-48-day market generates the same referral opportunity only if the vendor feels they were guided accurately through a genuinely difficult process — not simply subjected to a prolonged campaign with no adaptive strategy.
How Auction Clearance Rates Predict Vendor Loyalty Across State Lines
Clearance rates function as a real-time vendor satisfaction barometer when read alongside campaign strategy. Randwick's 73.5% clearance rate at a $2,400,000 median, Toorak's 72% at $2,800,000, and Kirribilli's 72.5% at $2,650,000 represent markets where auction campaigns are producing the competitive conditions vendors were promised. When a property sells under the hammer above reserve in front of multiple registered bidders, the vendor satisfaction outcome is almost structurally guaranteed — assuming the reserve was set realistically and the marketing spend was proportionate.
The more instructive analysis applies to mid-range markets. Dandenong's 56% clearance rate at a $680,000 median and Port Macquarie's 46% rate at $850,000 indicate that a meaningful proportion of vendors in those markets are experiencing passed-in results and post-auction negotiation — a process that consistently produces lower satisfaction outcomes than a clean auction result, regardless of the final price achieved. Agents in these markets who default to auction campaigns without a clear rationale for why auction suits that specific property and buyer pool are creating structural dissatisfaction risk.
For the purposes of repeat business modelling, the relevant metric is not whether the auction cleared — it is whether the vendor felt the method was right for their circumstances. An agent who recommends private treaty in a 46%-clearance market, achieves a result within 3% of the vendor's expectation in 38 days, and communicates transparently throughout will generate stronger loyalty than an agent who pushed an auction campaign that passed in at $815,000 before a lower private negotiation concluded at $830,000 two weeks later. Understanding how to measure real estate agent performance through these layered metrics — clearance rate, days on market, sale-to-appraisal ratio — is the analytical foundation for any serious agency benchmarking exercise.
Vendor Advocacy as a Structural Response to Satisfaction Risk
The Springwood collapse crystallises exactly the scenario in which Vendor Advocacy — Do You Need One? becomes a directly relevant service for sellers assessing complex or high-value campaigns. Vendor advocates exist to provide property owners with independent representation — selecting the agent, scrutinising the marketing strategy, and monitoring campaign performance against benchmarks. In a market where developer collapses, method-of-sale mismatches, and extended days-on-market campaigns are eroding vendor confidence, the advocate's role is to introduce a layer of accountability between the vendor and the selling agent that the vendor would otherwise lack.
The fee structure — typically paid by the selling agent from their commission rather than directly by the vendor — removes the financial friction that might otherwise deter sellers from engaging independent oversight. For vendors in slower markets like Ballina (45 days, 47% clearance, $1,350,000 median) or Dandenong (40 days, 56% clearance, $680,000 median), an advocate who can identify the right agent for those specific conditions and negotiate campaign terms that align method-of-sale with market depth is providing a service with direct price and satisfaction outcomes. For further context on how commission structures interact with this arrangement, the How Real Estate Agent Commissions Work guide provides a detailed state-by-state breakdown.
Agents who proactively embrace vendor advocacy referrals — rather than resisting them as margin compression — are positioning themselves for repeat business from vendors who entered their transaction with calibrated expectations. The satisfaction gap in Australian real estate is not primarily a price gap. It is an expectation management gap, and agents who close it through transparent communication, method-of-sale discipline, and accountable campaign reviews will generate the referral economics that compound over a four-to-seven-year property cycle. For broader international comparison on how agency accountability frameworks operate across comparable markets, international property market comparison data provides relevant context on where Australia sits relative to peer markets.
The SMH Sub-$1.5m Sydney Market and What It Means for Agent Referral Chains
A parallel dynamic is visible in the Sydney sub-$1.5 million segment. According to SMH Property, buyers on a budget can still find stylish and liveable options in Sydney if they know where to look — particularly in a market downturn. This framing is significant for agents operating in the Penrith ($880,000 median, 35 days) and Liverpool ($850,000 median, 38 days) corridors, where the sub-$1.5 million buyer pool is most active.
In these price bands, the vendor satisfaction and repeat business equation is particularly sensitive to initial appraisal accuracy. A vendor who lists at $950,000 based on an optimistic appraisal, sits through 35 days of inspections, and ultimately accepts $895,000 has experienced a satisfaction outcome that correlates strongly with agent-switching at their next transaction — even if $895,000 was a fair market result for that property in July 2026 conditions. Agents who set appraisals within 3-5% of final sale price in these price bands, supported by comparable sales data and transparent market commentary, generate the vendor confidence that converts to referrals within the same postcode network.
For agents working the Surry Hills ($1,920,000 median, 23 days, 73% clearance) and Kirribilli ($2,650,000, 24 days, 72.5% clearance) markets, the satisfaction dynamics are structurally different — faster sales, competitive buyer pools, and higher absolute prices create a more forgiving environment for minor campaign missteps. The real vendor satisfaction test for Sydney agents in 2026 sits in the $850,000-to-$1.5 million band, where buyer finance conditions, extended holding periods, and method-of-sale decisions have the greatest impact on whether a vendor recommends their agent or quietly moves to a competitor at the next listing event.
What the Data Signals for Agents, Buyers, and Vendors in the Near Term
The Wel. Co Springwood collapse, combined with July 2026's fractured clearance rate and days-on-market data, sends a clear signal to agents across all price bands: vendor satisfaction is now a competitive differentiator, not a baseline expectation. In markets where South Perth sells in 17 days and Nedlands in 15, agents who cannot explain why their equivalent market takes 35-to-48 days will lose listings to competitors who can. For vendors, the data supports a more rigorous pre-campaign interrogation of agent performance metrics — specifically, sale-to-appraisal ratio, median days on market for comparable properties, and clearance rate by method of sale. For buyers navigating the sub-$1.5 million Sydney market or the broader regional Queensland uncertainty created by the Springwood fallout, the agent's track record on settlement risk management — including their due diligence on developer-linked comps — is now a material selection criterion. Agents who build repeat business on transparency, calibrated appraisals, and method-of-sale discipline will compound their referral pipelines through the second half of 2026; those who do not will find vendor satisfaction gaps translating directly into lost market share.